
How to read candlesticks on the chart?
In this article, we will understand how to read candlesticks on the chart.
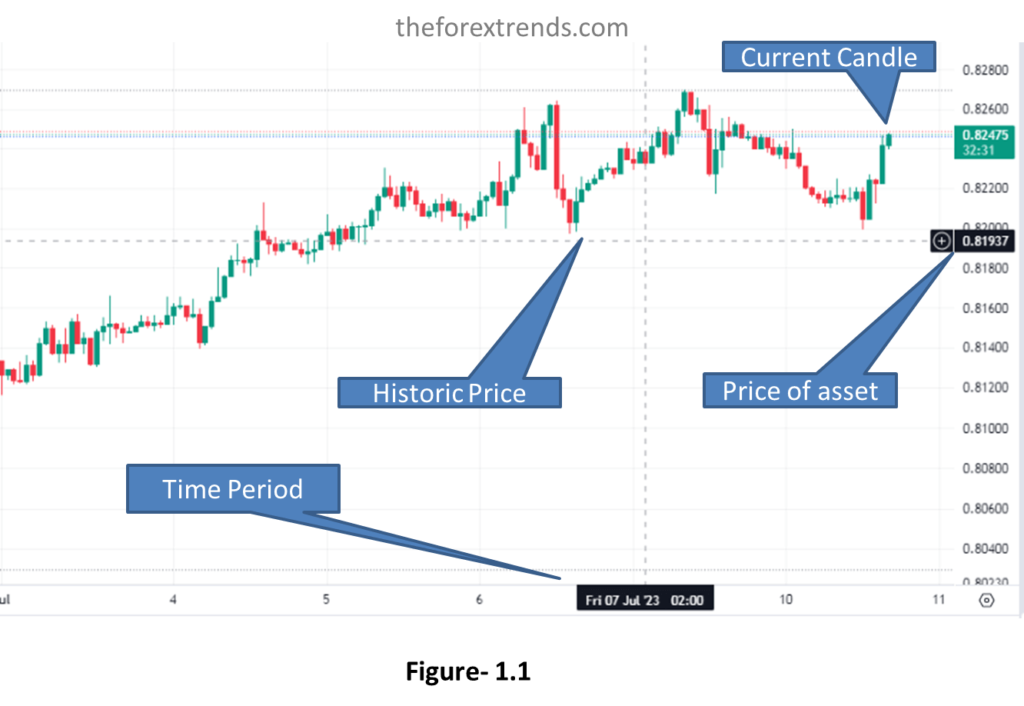
Most beginner traders simply look at candlestick charts because Japanese candlesticks are easy to understand rather than line charts or bar charts. The numbers written on the right side of the chart indicate the price of the respective asset. The numbers at the bottom of the chart indicate the period. The very last candle to the right is the current candle, indicating the current market price. All the previous candles, to the left of the current candle, have recorded historic price movement during that time frame. Look the Figure-1.1 below for reference.
Understand the Highs on the chart:
Highs are defined as a level where the market ceases to rally and U-turns in the opposite direction. You can spot a high between four candles when the two to the left and the two to the right are lower than the center wick, which is the highest. A high can be considered a new level of resistance, or a higher price level achieved by the bulls that is interrupted and reversed by the bears. Remember, not all highs are major levels of resistance. We will discuss resistance deeply later on. Now look the Figure-1.2 as I marked resistance on high.
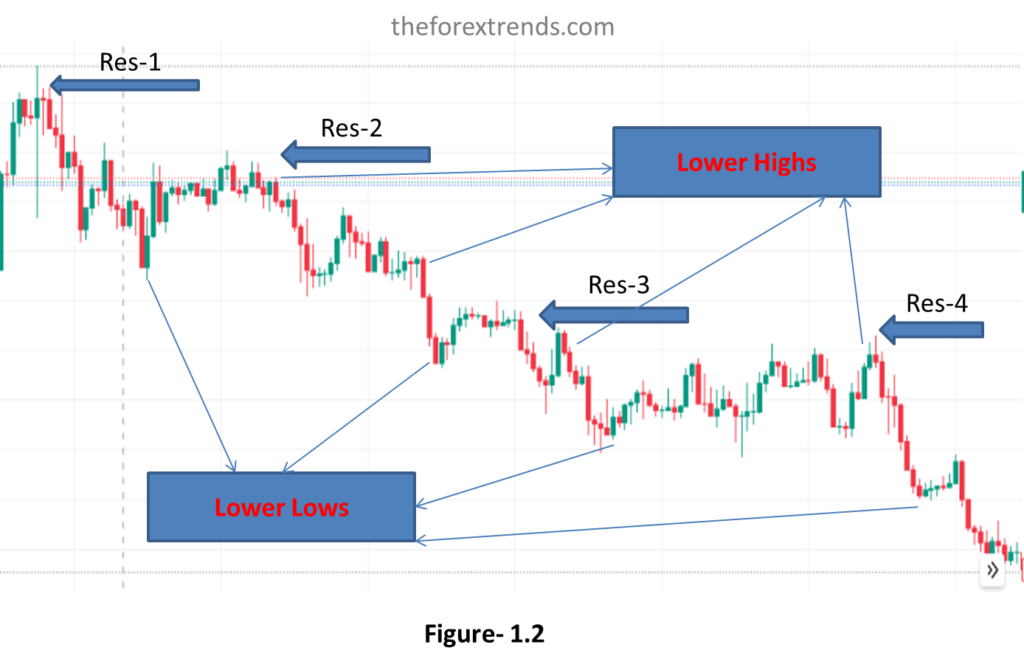
The levels of resistance market in the above chart as res-1, res-2 …. Will become future price targets for the bulls to chase and move higher. When the bulls regain control of the market, they will aim to make higher highs and higher lows. The bears are kept in control in the above chart as the market is making lower lows and lower highs.
Understand the Lows on the chart:
A low is defined as the level where the market ceases to drop. you can see a low candlestick formation where there are two candles to the left and two candles to the right that are higher than the center wick, which is the lowest point. A low can be considered as a new level of support or a lower price level that was achieved by the bears and then interrupted and reversed by the bulls. you can consider a low as support. Remember, not all Lows are major levels of Support. We will discuss Support more deeply later on. Now look the Figure-1.3 as I marked supports on lows.
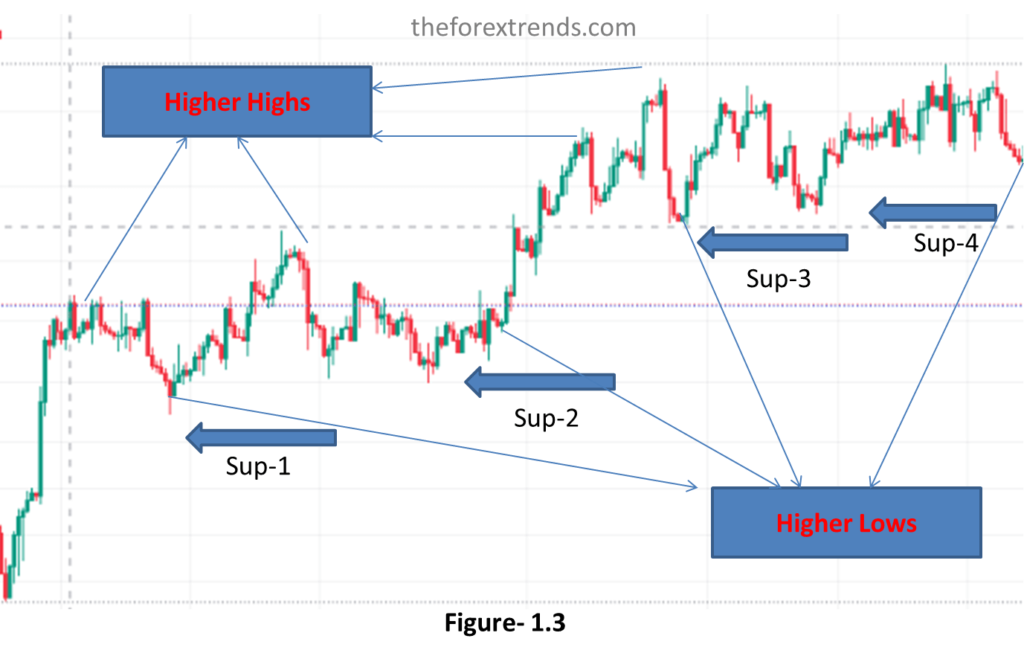
The levels of support noted in the above chart as sup-1, Sup-2, Sup-3 …. Will become future price targets for the bears to chase and move higher. When the bears regain control of the market, they will aim to make Lower highs and Lower lows. The bulls are kept in control in the above chart as the market is making higher lows and higher highs.
Conclusion:
Candlestick patterns gain more significance when observed in the context of preceding and subsequent candlesticks. Traders often analyze multiple candles to identify trends, and support/resistance levels. Remember that reading candlestick charts requires practice and experience. It’s essential to continually educate yourself on candlestick patterns and technical analysis concepts to become proficient in using them for Forex trading.
I hope this article is helpful for you to understand how to read candlesticks on the chart.
Stay tuned to our website for more tutorials about Forex Market. If you have any suggestions or queries, feel free to Contact us or drop your message in the comment section below.
In this article, we will understand how to read candlesticks on the chart. Most beginner traders simply look at candlestick charts because Japanese candlesticks are easy to understand rather than line charts or bar charts. The numbers written on the right side of the chart indicate the price of the respective asset. The numbers at…