
Important Candlestick Patterns and their impacts
In this article, we will discuss the Important Candlestick Patterns and their impacts.
Hundreds of candlestick patterns are used by the traders in trading industry. But it is not possible to remember the entire pattern and also it confused you. That’s why we picked up only nineteen patterns of the candlestick for you, and believe it is more than enough to have a solid understanding of candlestick formations and their meaning. Let’s learn about these Important Candlestick patterns and their impacts.
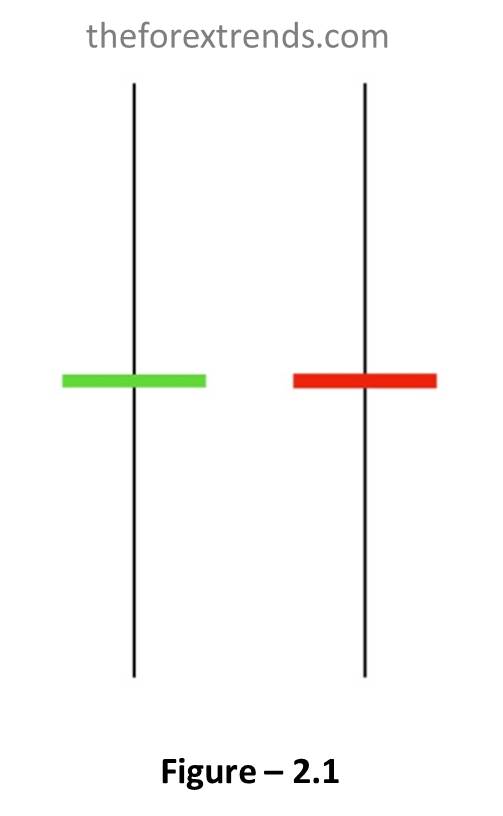
Doji Candle:–
It is a neutral pattern. A Doji has a small real body, indicating that the opening and closing prices are very close or virtually the same. That’s why it is known as the indecision candle. This candle can appear in several different patterns. Refer to Figure -2.1 for visualization.
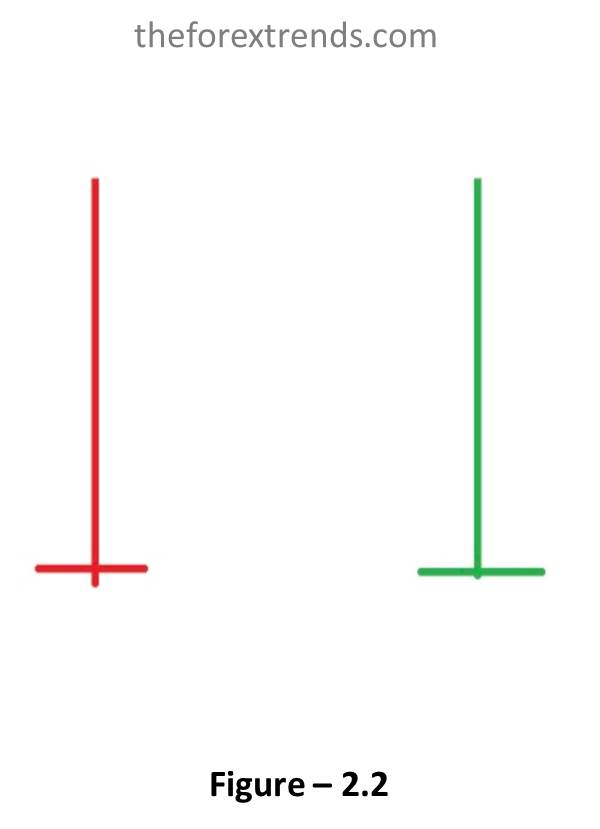
Gravestone Doji:–
It is a bearish pattern. This candle signifies another turning point. It occurs when the open, close, and low are the same and the high is significantly higher than the open, low, and closing prices. Refer to Figure -2.2 for visualization.
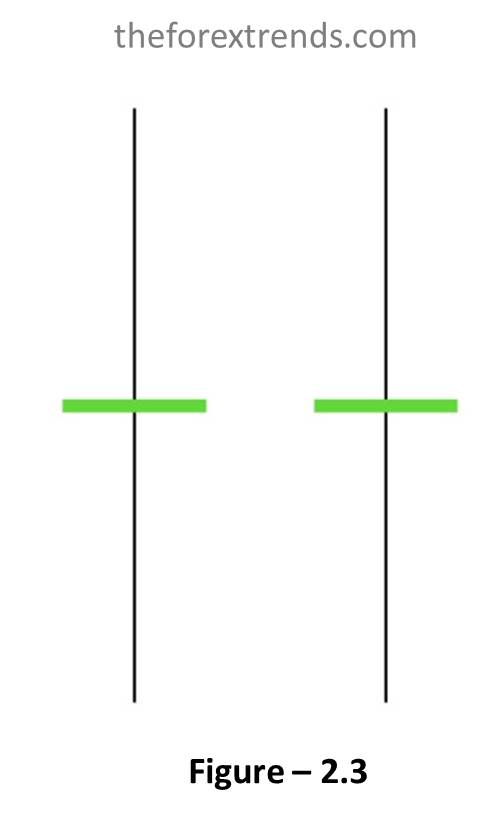
Double Doji:–
It is a neutral pattern. The double Doji pattern is formed when two consecutive Doji appears in the same price range. This implies a forceful move will follow a breakout from the current indecision. Refer to Figure -2.3 for visualization.
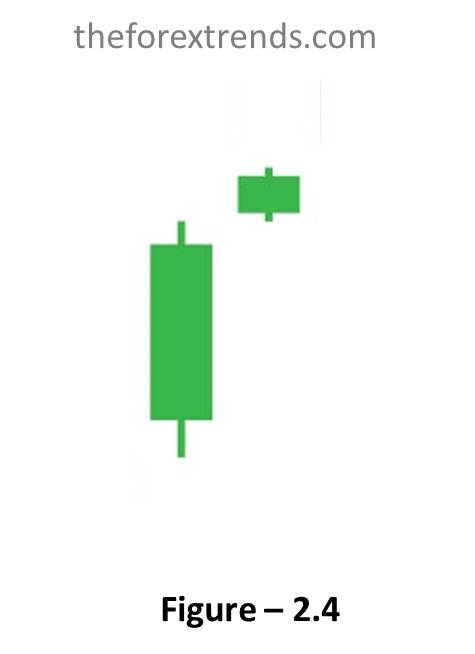
Star:–
It is a bearish pattern. Stars indicate reversals. A star is a candle with a small real body that occurs after a candle with a much larger real body. Where the real bodies do not overlap, although the wicks may overlap. Refer to Figure -2.4 for visualization.
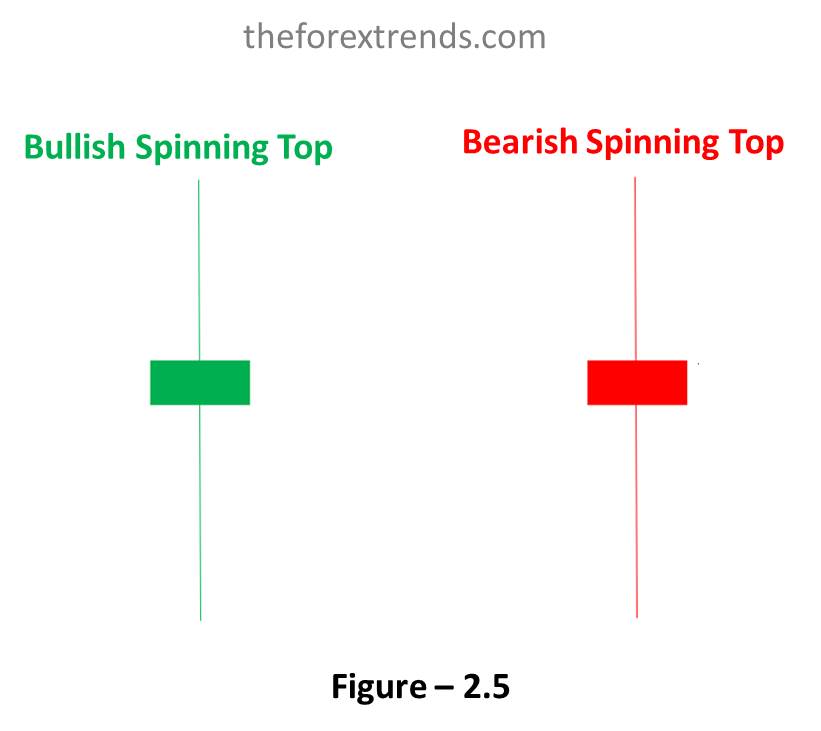
Spinning Top:–
These are Neutral candles. They occur when the distance between the high and the low, and the distance between the open and the close are relatively small. Refer to Figure -2.5 for visualization.
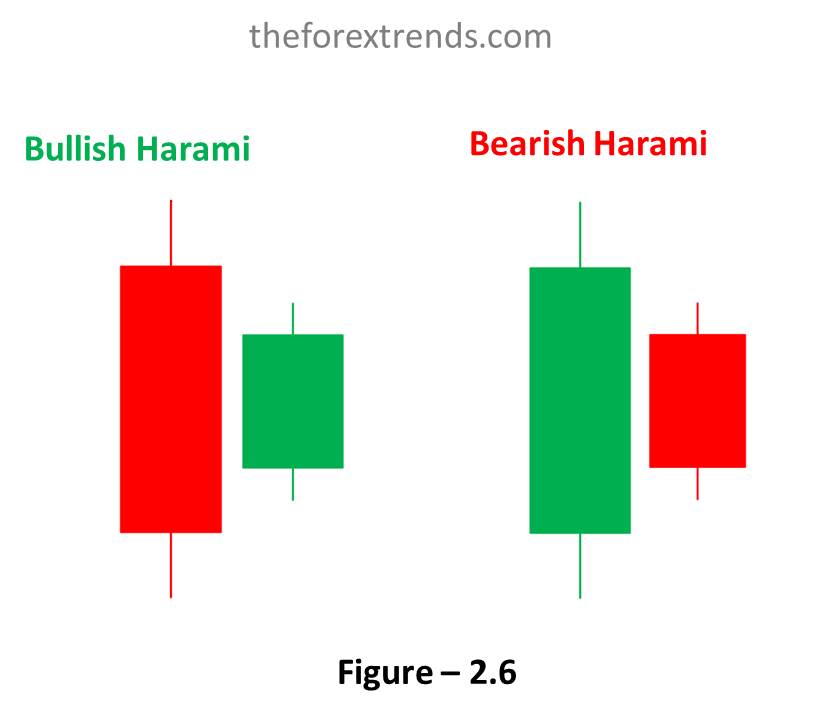
Harami Candles:–
These are neutral patterns. This pattern indicates a decrease in momentum. It occurs when a candle with a small body falls within the area of a larger body. As you can see in Figure-2.6 a bullish candle with a long body is followed by a weak bearish candle and implies a decrease in the bullish momentum.
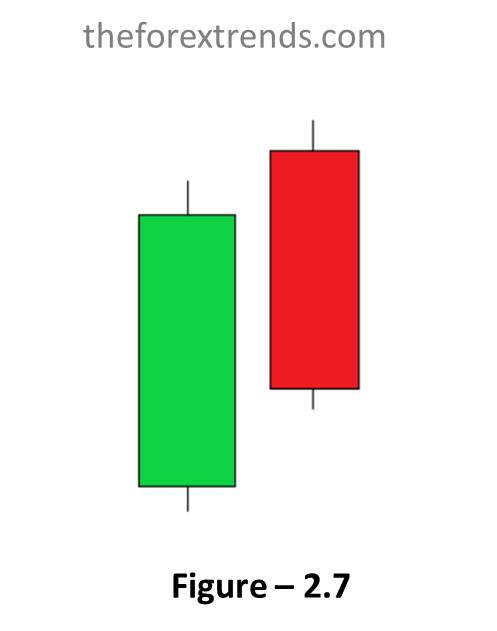
Dark cloud cover:–
This is a bearish pattern. This is more significant if the second candle’s body is below the center of the previous candles’s body as you can see in Figure- 2.7
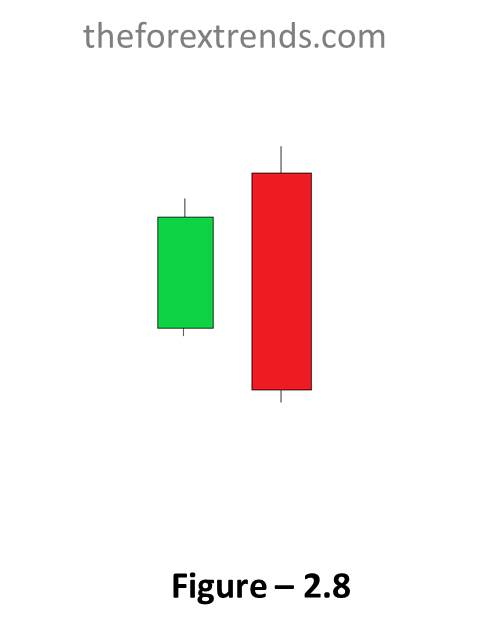
Bearish Engulfing Candles:–
This is a bearish pattern. This pattern is strong and bearish if it occurs after a significant uptrend. This pattern acts as a reversal pattern. It occurs when a small bullish candle is engulfed by a large bearish candle. Refer to Figure -2.8 for visualization.
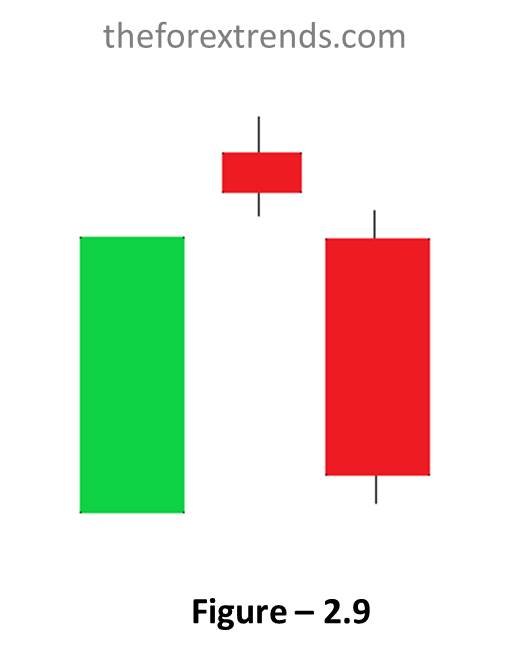
Evening star:–
This is a bearish pattern signifying a potential top. This evening star indicates a possible reversal and the bearish candle confirms it. The evening star can be green or red or it can be a Doji star. Refer to Figure -2.9 for visualization.
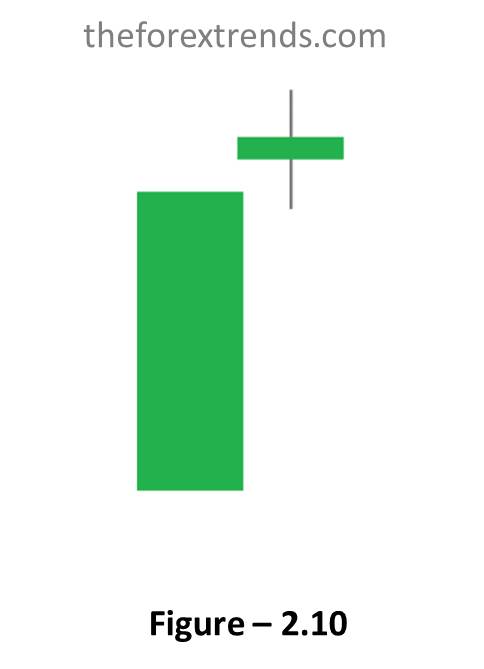
Doji star:–
This is a bearish pattern. A star indicates a reversal and a Doji indicates indecision. Thus, this pattern usually indicates a reversal after an indecisive period. You should wait for a confirmation, such as an evening star illustration, before trading a Doji star. Refer to Figure -2.10 for visualization.
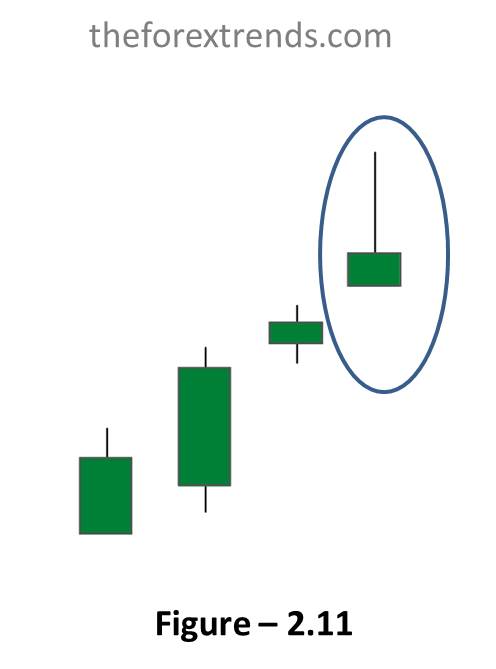
Shooting star:–
This is a bearish pattern. This pattern suggests a minor reversal when it appears after a rally. The star’s body must appear near the low price, and the candle should have a long upper shadow. Refer to Figure -2.11 for visualization.
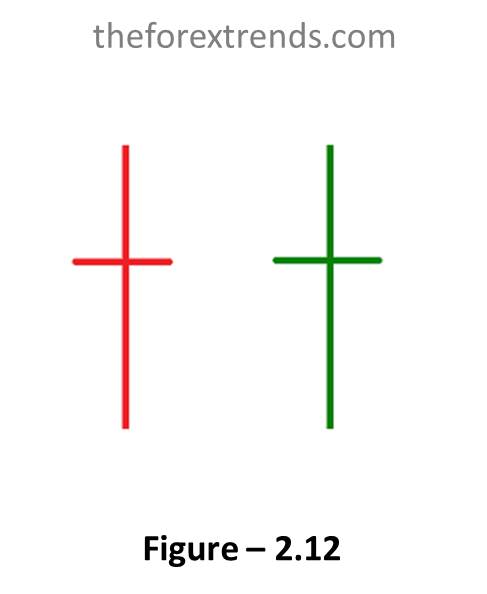
Long legged Doji:–
This is a bearish pattern. This candle often signifies a turning point. It occurs when the open and close are the same, and the range between the high and the low is relatively large. Refer to Figure -2.12 for visualization.
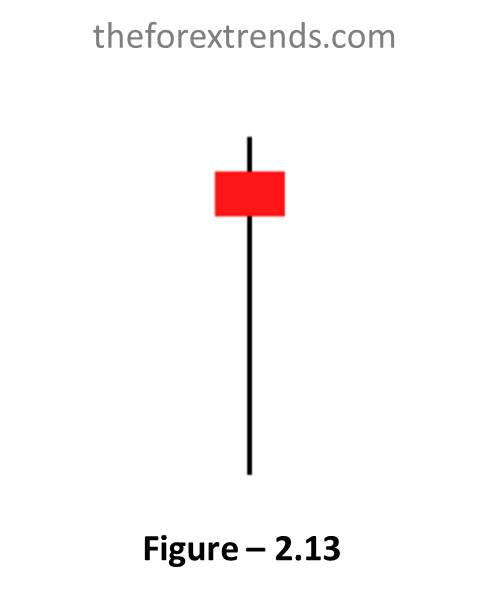
Dragonfly Doji:–
This is a bearish pattern. This candle also signifies a turning point. This pattern occurs when the open and close are the same and the low is significantly lower than the open, high, and closing prices. Refer to Figure -2.13 for visualization.
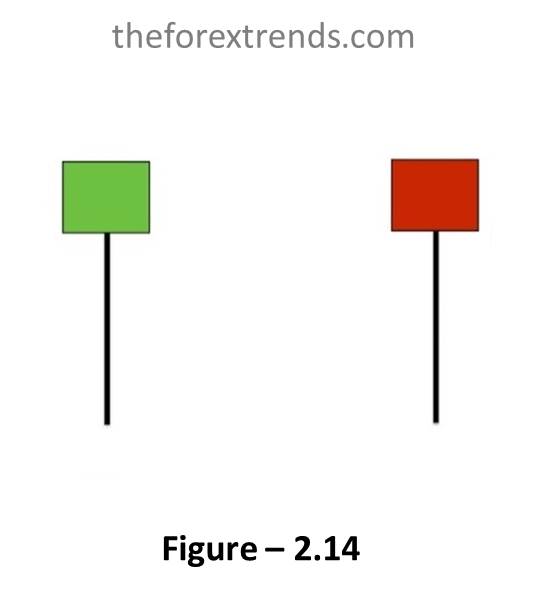
Hammer:–
This is a bullish candle if it occurs after a significant downtrend. If the candle occurs after a significant uptrend.it is called a hanging man. A hammer is identified by a small body (a small range between the open and closing price) and a long lower shadow (the low is significantly lower than the open, high, and closes). The body can be red or green. Refer to Figure -2.14 for visualization.
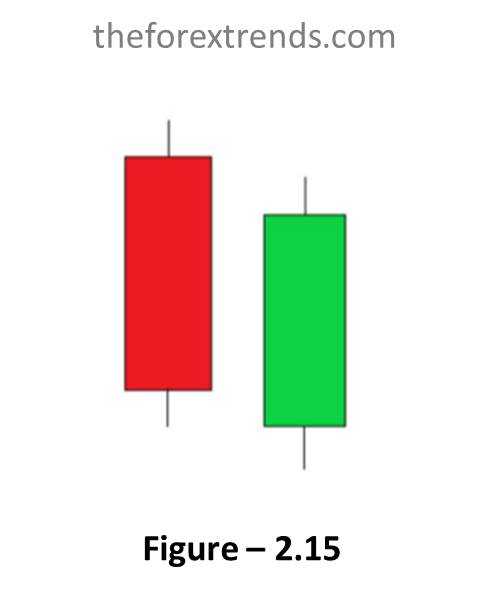
Piercing Candle:–
This is a bullish pattern and the opposite of a dark cloud cover. The first candle on the left is a bearish candle, and the second candle is a bullish candle. The second candle opens lower than the first candle’s low but closes more than halfway above the first candle’s real body. Refer to Figure -2.15 for visualization.
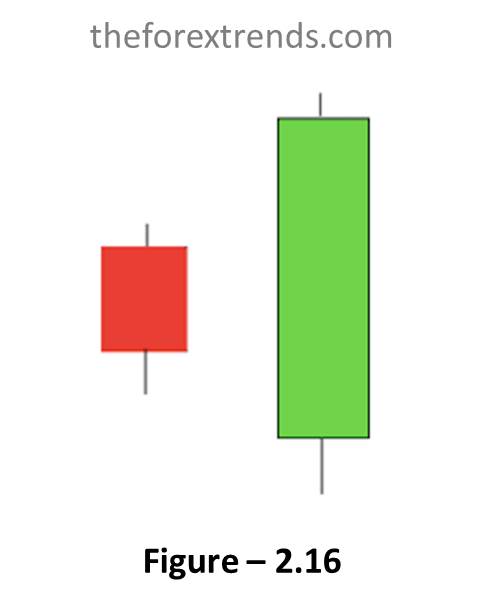
Bullish engulfing candles:–
This pattern is strongly bullish if it occurs after a significant downward rally. This pattern acts as a reversal pattern. It occurs when a small bearish candle is engulfed by a large bullish candle. Refer to Figure -2.16 for visualization.
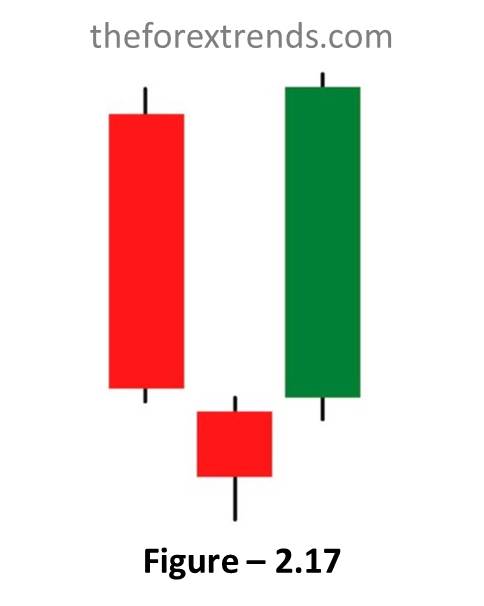
Morning star:–
This is a bullish pattern signifying a potential bottom, the star, at the bottom between the two candles, indicates a possible reversal. The bullish candle confirms this reversal. The star can be red or green. Refer to Figure -2.17 for visualization.
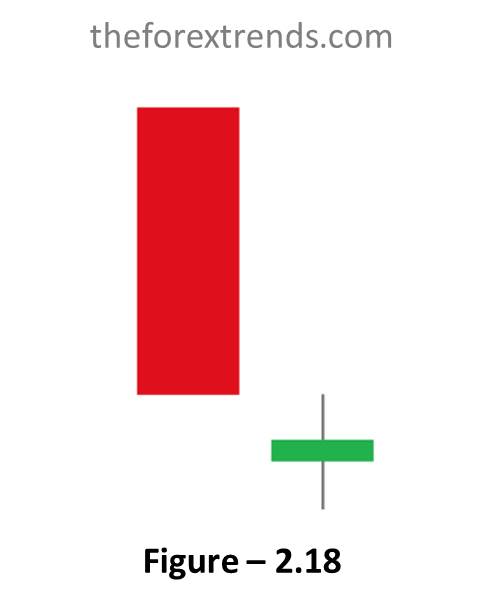
Bullish Doji star:–
This is a bullish pattern. A star indicates a reversal and a Doji indicates indecision. Thus, this pattern usually indicates a reversal after an indecisive period. You should wait for a confirmation, as in the morning star in the previous pattern, before trade execution on the Doji star. The first candle can be red or green, it does not matter. Refer to Figure -2.18 for visualization.
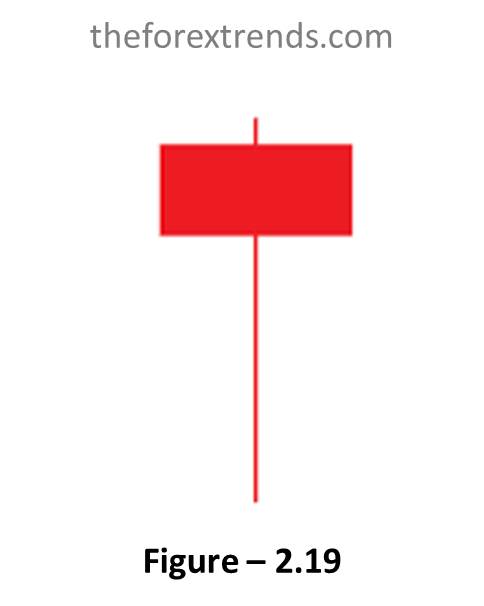
Hanging man:–
These candles are bearish if they occur after a significant uptrend. And if the pattern occurs after a significant downtrend it is called a hammer pattern. These candles are identified by small real bodies (A small range between open and closing price) and long lower wick. That is, the low was significantly lower than the open, high, and close. The bodies can be red or green, it doesn’t matter. Refer to Figure -2.19 for visualization.
It’s important to note that while candlestick patterns can provide insights, they are not foolproof indicators and should be used in conjunction with other technical analysis tools and risk management strategies. It is better to have multiple confluences with the above candlestick patterns for getting an extra edge on your trading.
I hope this article is helpful for you to understand the Important Candlestick Patterns and their impacts.
Stay tuned to our website for more tutorials about Forex Market. If you have any suggestions or queries, feel free to Contact us or drop your message in the comment section below.
In this article, we will discuss the Important Candlestick Patterns and their impacts. Hundreds of candlestick patterns are used by the traders in trading industry. But it is not possible to remember the entire pattern and also it confused you. That’s why we picked up only nineteen patterns of the candlestick for you, and believe it…