
Japanese Candlesticks
In this article, we will discuss Japanese Candlesticks.
Candlestick formations are the sign language of the market. They frequently tell you the probability of price movement. There are three types of charts traders can refer to a line chart, a bar chart, and a candlestick chart. In the recent era of trading the line chart and bar chart are not used by traders most. Now even the world’s top traders are using Japanese candlestick charts for the additional information they can provide.
It was in 1600 that the concept of the Japanese candlestick was explored, tested, and used in monitoring prices in the rice market of Japan. After the lapse of a few decades candlestick charts are now included in the majority of financial carting packages as a slandered option and are a key indicator for establishing a method of price and analysis.
How to read a Japanese candlestick?
Japanese candlestick charts monitor price movement during a certain period of time. As the candlesticks form, they begin to tell a story of the activity in the market, as well as reflect the mood of the marker during that time. Candlestick patterns are always telling you the future probability of price in the Forex market. Successful traders take time to study and understand this casual language. Candlestick formations indicate clear buy and sell signals, communicating to the trader when it is time to enter the market or to get out. They will appear in the form of a single candlestick or a combination of more than one candlestick.
Let us see what a Japanese candlestick looks like and how it forms:
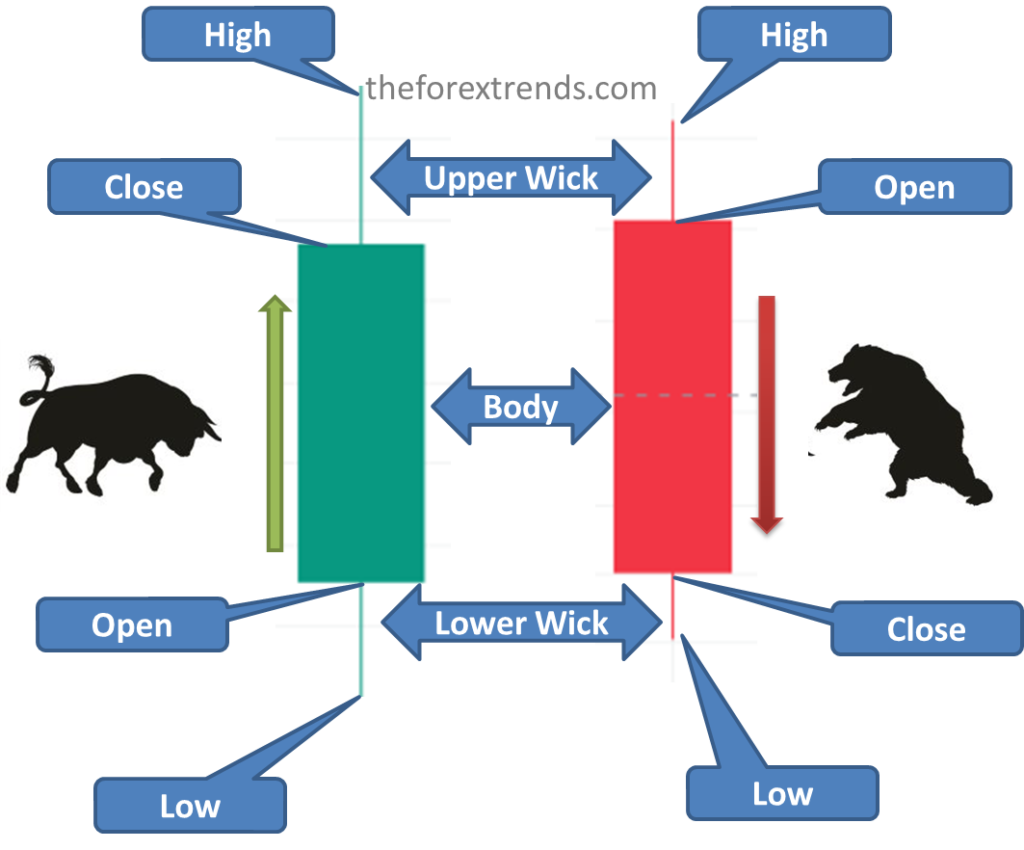
Candlesticks, which are composed of full bodies and wicks, measure price fluctuations within a certain period of time as prices move up or down from the opening, the body begins to form. If from the opening price, prices move up and then close higher than the opening, it is a bullish candle. These candlesticks will always appear in white or green color.
If prices begin to fall from the opening price and close lower than the opening, it is a bearish candle. These candlesticks will always appear to be black or red – which indicates their bearish nature. The lines on the upper side and lower sides of the bodies of the candles are called wicks of shadow. The upper wicks of the candles indicate the highest price high, and the lower wicks of the candles indicate the lowest price or low of that time period.
Monitoring Price movement with Candlestick:-
For example, there are multiple time frames in your chart like 5 Min, 15 Min, 1 hr, 4 hr, Daily, Weekly, Monthly, etc. Candlesticks monitor price movement against time, providing traders with four key prices of information for that specific time period that you selected in your chart.
- The opening price
- The closing price
- The highest price reached
- The lowest price reached
Forex trading is a financial game involving two opponents: the bulls and bears. Forex traders around the world, have been trading either in a bullish direction or in a bearish direction. Both sides have clear objectives and want the marker to move in their direction: bulls want the market to go up, or rally, to make higher highs, whereas the bears want to take the market down, or have it deep to make lower lows.
I hope this article is helpful for you to understand Japanese Candlesticks.
Stay tuned to our website for more tutorials about Forex Market. If you have any suggestions or queries, feel free to Contact us or drop your message in the comment section below.
In this article, we will discuss Japanese Candlesticks. Candlestick formations are the sign language of the market. They frequently tell you the probability of price movement. There are three types of charts traders can refer to a line chart, a bar chart, and a candlestick chart. In the recent era of trading the line chart…